Drivers of digital transformation
Advancing digital transformation in the water sector is only possible when the utilities’ motives for action are understood. While the motivations for the uptake of digital technologies may depend greatly on case-specific conditions and personal mindsets, we chose to categorize the potential drivers of digital transformation examined in this study into three groups: hydroclimatic factors (HCL), primarily including floods and droughts; economic factors (ECO), including cost benefits and competitive advantages; and factors attributed to government regulation (GOV), including restrictive regulation as well as incentives & subsidies. Figure below reports the distribution of these groups for each utility subdivision as stated by the surveyed water utilities in relation to the UDS. Additionally, the relative frequency of each driving element is annotated in the colored boxes of each subplot.
Overall, economic factors were found to have the largest influence on digital transformation (66% of occurrences across all subdivisions). Government regulation and hydroclimatic factors are driving elements in 26 and 8% of the cases, respectively. The development in the IT subdivision is predominantly driven by economic factors (85%). This is also the case for the WD (70%, Fig. 4b) and the CD subdivisions (67%, Fig. 4d). A less distinct picture is presented in the WS and WW subdivisions, where the influence of both government regulation and hydroclimatic factors on digital transformation increases. The major drivers among hydroclimatic factors are droughts in the WS subdivision (18%) and floods in the WW subdivision (21%).
However, while mainly economic factors motivate utilities to tackle their digital transformation and start such a journey, we did not find empirical evidence supporting the claim that these factors also influence the successful implementation of their digitalization strategy. Figure below already suggests that there is no clearly emerging pattern linking the distribution of HCL, ECO, and GOV drivers with the UDS achieved by a utility. This is confirmed more thoroughly by the analysis of variances which suggests that no particular driving element is significantly dominating a utility’s progress of digital transformation, reflected by its UDS, when considering a confidence level of 95%. The gap between motivations and actual technology adoption may depend on various factors that are not captured in the three types of determinants considered in this study, including internal processes, company structure, or even individual vision, understanding, and capability of utility managers.
Key-enabling technologies for digital transformation
To identify the key-enabling technologies for the digital transformation of water utilities, we analyzed the penetration of individual digital technologies across all water utilities in the sample of respondents by computing the technology availability score. The TAS computes the unweighted average of the digitalization score for a single digital technology across all utilities, hence, indicating its availability among the entire set of utilities. Unlike the UDS, the TAS focuses on the deployment of individual technologies rather than a utility’s overall digitalization progress.

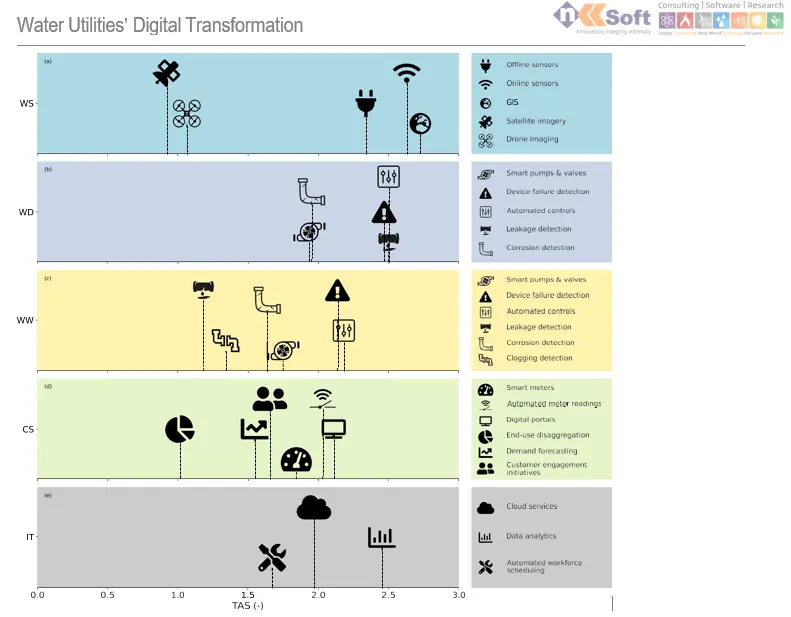
Fig. Explanation: Penetration of digital technologies in different water utility subdivisions. The technology availability score (TAS) is computed for individual technologies and refers to their application to individual subdivisions in the entire water utility sector: a WS; b WD; c WW; d CD; and e IT. TAS values of 0 indicate low penetration and availability of a given technology, and values of 3 indicate high penetration and availability.
The resulting scores are displayed in Fig. above. Widely adopted digital technologies with higher TAS may function as entry points to digital transformation. Conversely, the adoption of digital technology with lower TAS could pose greater hurdles to utilities and, therefore, require more experience and maturity in digital transformation.
Figure above confirms our previous findings on the overall progress in the digitalization of utilities across their subdivisions. WD subdivision appears the most digitalized and related technologies seem already deployed and operational throughout most utilities. These include automated controls (TAS = 2.50), leakage detection (TAS = 2.50), and device failure detection (TAS = 2.47) algorithms, which are among the most widespread digital technologies within the sample of utilities. Conversely, digital technologies in the CD subdivision remain primarily in the planning stage or are only starting to be deployed. Digital portals (TAS = 2.11) and smart meters (TAS = 1.84) in combination with automated meter read- ing (AMR) (TAS = 2.03) appear to be more in the testing and initial deployment phase. The implementation of End-use disaggrega- tion (TAS = 1.02) especially is planned at a later stage or not considered at the time of the survey. Unlike other subdivisions, the range of TAS scores in the WS subdivision is rather large.
Geographic Information Systems (GIS) (TAS = 2.73) and on-site offline (TAS = 2.34) and online (TAS = 2.63) sensing technologies are in operation with mostly all utilities, while remote sensing technologies with drones (TAS = 1.06) and satellite imagery (TAS = 0.92) are instead planned at later stages. Overall differences and TAS trends across subdivisions suggest that digital innovation is being embraced gradually in the water sector rather than in a disruptive manner.